
ExploraTour: A Peek into the Lives of the Stars
Sorting Stars into Groups (The Hertzsprung - Russell (HR) Diagram)
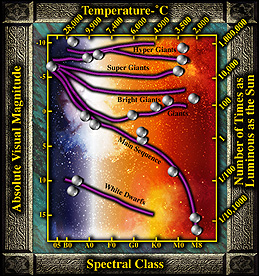
Two scientists, Hertzsprung and Russell, used these very interesting properties of stars. They arranged stars on a chart according to their color and brightness. This chart is called the Hertzsprung-Russell (HR) diagram.
This figure gives you some idea of how the sizes and colors of stars change with brightness and temperatures on the HR diagram. The diagonal lines mark where stars with radiuses from 1000 to 1/100 time the solar radius appear on the chart. Sample stars with radiuses 1/100 to 10 times the sun's radius are shown so you can get a feeling for their relative sizes with colors given by their location on the chart.
The largest stars in the galaxy are found near the top, the smallest stars near the bottom. The bluest stars appear on the left, the reddest stars on the right.
Now let's look at a real HR diagram ...