Visualize Climate Change
Use the menu in the upper left corner of the interactive below to select a map to view. Choices include contemporary global surface air temperature and sea surface temperature, changes in temperature by 2000, and four climate model projections for possible future climate in 2025 and 2095.
Last modified April 21, 2009 by Lisa Gardiner.
You might also be interested in:
Leaders from 192 nations of the world are trying to make an agreement about how to limit emissions of heat-trapping greenhouse gases, mitigate climate change, and adapt to changing environmental conditions.
...more
Climate in your place on the globe is called regional climate. It is the average weather pattern in a place over more than thirty years, including the variations in seasons. To describe the regional climate
...more
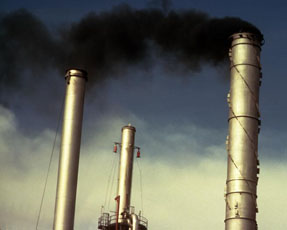
Less than 1% of the gases in Earth's atmosphere are called greenhouse gases. Even though they are not very abundant, these greenhouse gases have a major effect. Carbon dioxide (CO2), water vapor (H2O),
...more
Television weather forecasts in the space age routinely feature satellite views of cloud cover. Cameras and other instruments on spacecraft provide many types of valuable data about Earth's atmosphere
...more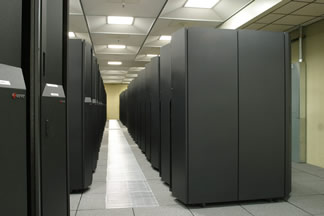
Predicting how our climate will change in the next century or beyond requires tools for assessing how planet responds to change. Global climate models, which are run on some of the world's fastest supercomputers,
...more
The world's surface air temperature increased an average of 0.6° Celsius (1.1°F) during the last century according to the Intergovernmental Panel on Climate Change (IPCC). This may not sound like very
...more
A factor that has an affect on climate is called a forcing. Some forcings, like volcanic eruptions and changes in the amount of solar energy, are natural. Others, like the addition of greenhouse gases
...more