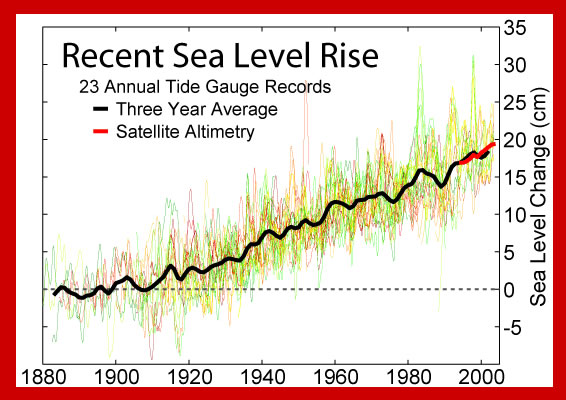
This graph shows the change in sea level since 1880. Sea level rose more than 18 centimeters during the 20th Century. The data used to make this graph come from 23 tide gauges. The thick black line is an average.
Courtesy of Robert A. Rohde/Global Warming Art Project