


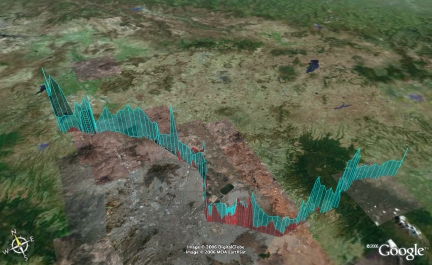
Courtesy of David Greenberg | ||||
| ||||
You might also be interested in:
Cool It! Game
Check out our online store - minerals, fossils, books, activities, jewelry, and household items!...more
Carbon Monoxide - CO
Carbon monoxide is a colorless, odorless, tasteless gas. It is also flammable and is quite toxic to humans and other oxygen-breathing organisms. A molecule of carbon monoxide (CO) contains one carbon atom...more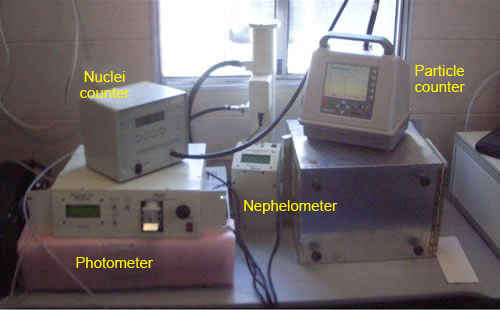
Light extinction of particles
Not all particles are the same, many of them have different shape, size, and composition. Some of them reflect or scatter light, and others absorb it. Two instruments on the image, photometer and nephelometer,...more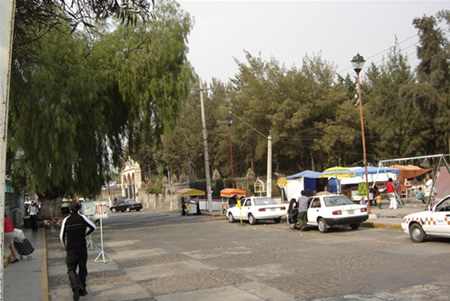
What does Tecamac mean?
Measuring site T1 is in Tecámac. This is a little town close to Mexico City. The name Tecámac is a Náhuatl word, an ancient Mexico's language, spoken by Aztecs. In Náhuatl, Tetl or Tec means stone, camatl...more
Peroxides Measured at the T1 Site
Hello again: We are nearing the end of our field campaign in Mexico. It has been a real adventure, with friendly people, great food, and interesting science. I obtained some good hydrogen peroxide measurements...more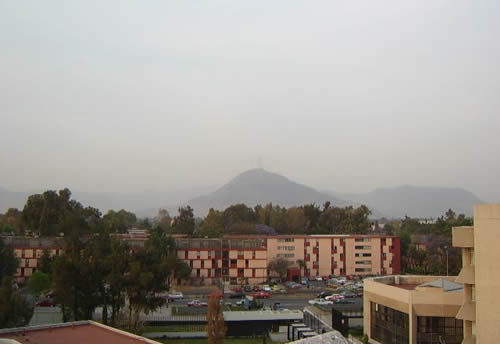
Cerro del Chiquihuite
Here is an example of how polluted the City is. This is a picture of "Cerro del Chiquihuite", which is situated around 5km (3miles) north from us. Chiquihuite is very close, indeed. However, we can barely...more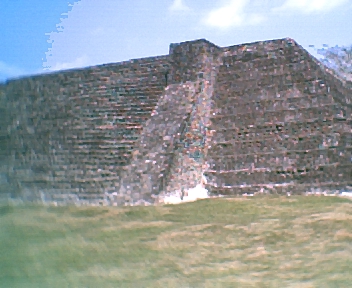
Ruins at Zempoala
On one of our down days, we took a little trip to a small town about 20 km from Veracruz. In the little town of Zempoala (also called Cempoala), there is a large area of partially restored ruins of ancient...more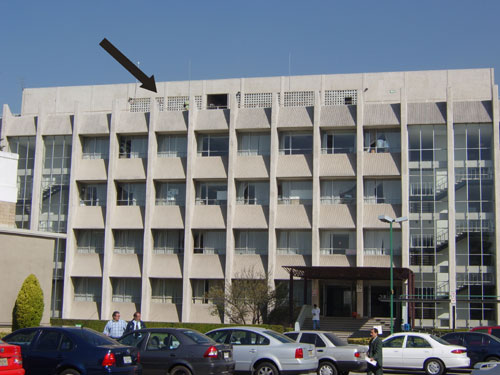
Please log in
Science Blogs
Real Climate: climate science from climate scientists

Windows to the Universe, a project of the National Earth Science Teachers Association, is sponsored in part is sponsored in part through grants from federal agencies (NASA and NOAA), and partnerships with affiliated organizations, including the American Geophysical Union, the Howard Hughes Medical Institute, the Earth System Information Partnership, the American Meteorological Society, the National Center for Science Education, and TERC. The American Geophysical Union and the American Geosciences Institute are Windows to the Universe Founding Partners. NESTA welcomes new Institutional Affiliates in support of our ongoing programs, as well as collaborations on new projects. Contact NESTA for more information.
