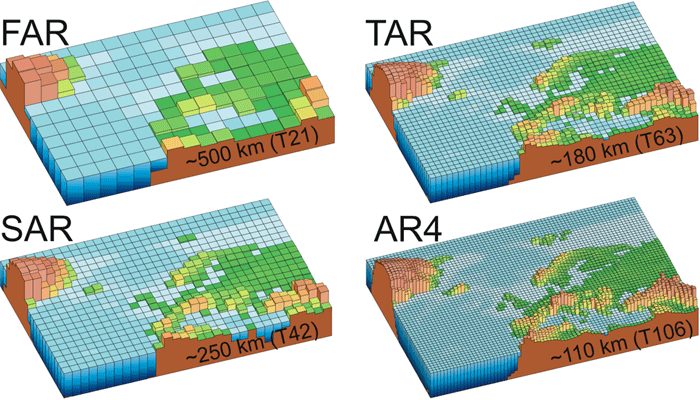

These images illustrate the typical spatial resolution used in state-of-the-art climate models around the times of each of the four IPCC Assessment Reports. Around the time of the First Assessment Report (FAR) in 1990, many climate models used a grid with cells of about 500 km (311 miles) on a side (upper left image). By the time of the the Second Assessment Report (SAR) in 1996, resolution had improved by a factor of two, producing grid cells 250 km (155 miles) on a side. Models references in the Third Assessment Report (TAR) in 2001 generally had reduced grid cells sizes to about 180 km (112 miles), while Fourth Assessment Report (AR4) models typically used a 110 km (68 mile) wide grid cell, further improving resolution. Vertical resolution is not depicted in these images, but has also improved over the years. Typical FAR models had a single-layer "slab ocean" and 10 atmospheric layers; AR4 models often include 30 layers in the oceans and another 30 in the atmosphere. Notice how elements of topography, such as the Alps Mountains, are shown in much greater detail in higher-resolution models. This allows such models to begin to make reasonable forecasts of regional climate in the future, a currently emerging capability.
Image courtesy of the IPCC (AR4 WG 1 Chapter 1 page 113 Fig. 1.4).