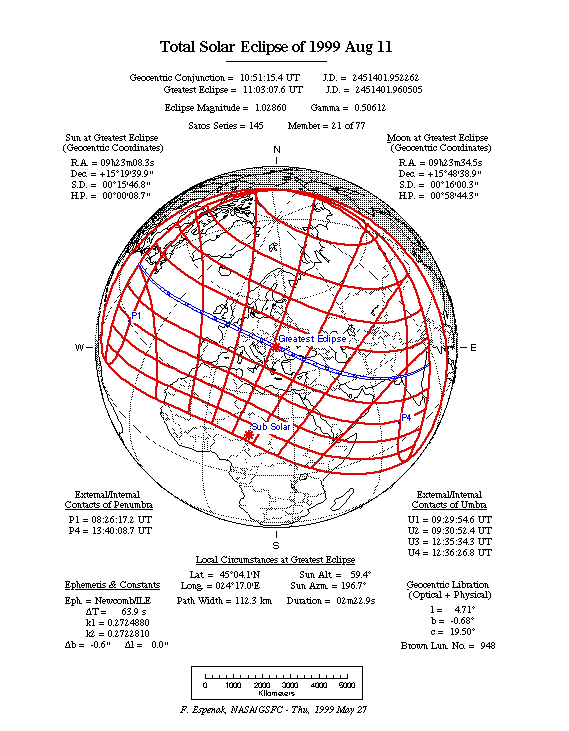
This diagram shows the path of the solar eclipse of August 11, 1999 and the degree of coverage of the Sun. Total eclipse of the Sun will occur along the blue line in the center of the red lines. Each red line represents a 20% increase in the amount of the Sun visible during the eclipse. The red line on either side of the center blue line represents 80% coverage of the Sun or 20% of the Sun visible.
Aris Multimedia Entertainment, Inc. 1994