NAME: __________________________
Place the bulb of one thermometer under the light colored snow and ice part of the photo.
Place the bulb of the other thermometer under the dark colored land or ocean part.
(Make sure both thermometers are sticking out from under the paper enough that you can read them.)
What's your hypothesis?
How do you think temperature of differently-colored areas will change when a light is shined at the photo?
Collect the data!
Use the table below to help you collect the temperature data.
| Time | Temperature ice picture | Temperature land or ocean |
| 0 minutes | ||
| 2 minutes | ||
| 4 minutes | ||
| 6 minutes | ||
| 8 minutes |
How is this different than the real world?
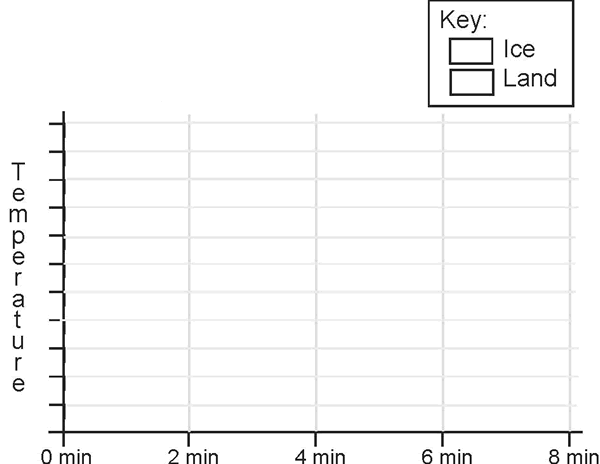
Graph your data
Plot the points and connect them into two lines:
One line for the ice photo temperature
One line for the land or ocean photo temperature
(Remember to fill in the temperature axis and the key.)

Interpret what the graph shows.
Explain in the space below.