
1. This graph shows how sea level has changes through time.
What is the vertical y-axis? __________________________
What is the horizontal x-axis? __________________________
2. Approximately how high was the sea level... (compared to today's sea level)
18,000 years ago? ______________
40,000 years ago? ______________
90,000 years ago? ______________
140,000 years ago? ______________
When sea level falls, the coastline moves in an oceanward direction.
When sea level rises, the coastline moves in a landward direction.
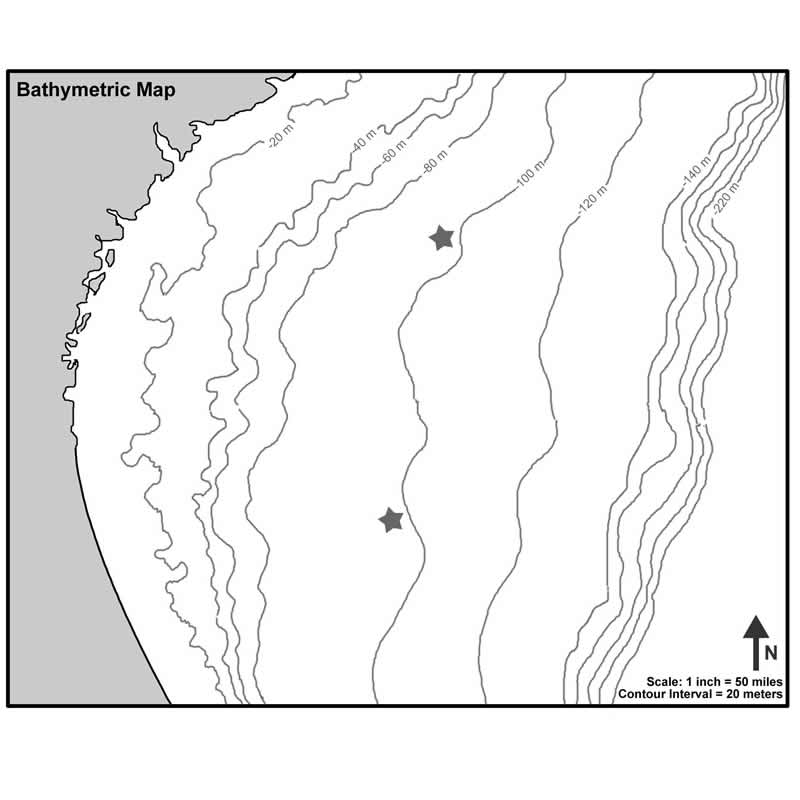
A bathymetric map shows the depth of an ocean or lake.
Contour lines connect points of equal depth below present sea level.
3. On the bathymetric map below,
Indicate where the coastline would have been at each of these times.
Draw each coastline as a line on the map in a different color.
Fill in the key to indicate which color matches which time.
Key:
4. The two stars show the locations of ancient archeological sites discovered by scuba diving archeologists. They found that these communities lived at
an ancient coastline and survived on a diet of fish. Given your knowledge of the changing sea level from the graph above, how old could these archeological sites be? ____________________
(Hint: < 20,000 years)