

Solar Variation
We tend to think of the Sun as steady, dependable, and never-changing. "As sure as the Sun will rise tomorrow" is our way of indicating absolute certainty. However, our Sun does change over time, though most humans are unaware of those changes for the most part. Some of those changes occur on time scales of hours or days. Others occur at rates measured in years or centuries, or even over the course of the multi-billion year history of the Sun. Some of the changes are regular and cyclic, while others are irregular and chaotic. Since the amount of energy our planet receives from the Sun is such a crucial ingredient in the behavior of Earth's climate, let's examine some of these changes in our solar system's furnace.
The Sunspot Cycle
Galileo was amongst the first to employ a telescope in making solar observations, and was deemed a heretic for (amongst other things) noting that the face of the Sun, which should have been (in the eyes of the church in that era) a perfect heavenly orb, had blemishes. Sunspots periodically march across the face of the Sun, and in fact were used to make the earliest measurements of the Sun's rotation rate. Over short time spans, the numbers, sizes, and locations of these spots seem to vary in unpredictable ways. However, by the mid-1800s astronomers realized that the number of sunspots waxed and waned in a cyclical fashion, which they soon determined had a periodicity of roughly 11 years.
|
This graph shows
annual sunspot counts for about the last 100 years. The cyclic increase
and decrease in the number of sunspots on a roughly 11-year period is
clearly evident, though the number of spots seen at the peak of each cycle
varies substantially. The 11-year period is an average; since 1700, some
cycles have been as short as nine years, while others were as long as
14 years. |
Sunspots are actually visual manifestations of tangled magnetic fields on the Sun. The Sun has an overall dipole (two magnetic poles, like a bar magnet) field similar in many ways to Earth's. However, the Sun, being a large ball of gas (or more accurately, plasma), does not all rotate at the same rate as does a solid sphere like Earth. The Sun rotates more rapidly at the equator (with a 27 day period) than it does at the poles (where the period is around 31 days). Over time, this differential rotation rate causes the Sun's magnetic field to become "all tangled up". The tangles are visually manifested as sunspots; regions of intense magnetic fields over a thousand times more powerful than the Sun's general field, where hot matter flowing up to the photosphere from the underlying convection zone is prevented from entering. Since the material in these regions is not refreshed by new, hot plasma from below, it cools and thus appears darker. Darker, at least, in the visible light portion of the spectrum. These zones of intense magnetism tend to spawn energetic disturbances in the Sun's atmosphere, unleashing vast solar storms (solar flares and Coronal Mass Ejections) that emit large blasts of X-ray and ultraviolet radiation.
|
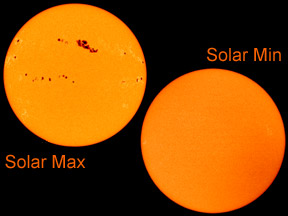
These visible light
images of the Sun show the variation in sunspot numbers. The image on
the left was taken near "Solar Max", a peak time in the sunspot
cycle. The image on the right was taken at "Solar Min", a lull
in the sunspot cycle. |
The electromagnetic emissions of the Sun, therefore, also increase and decrease in a cycle that matches the 11-year cycle of the sunspot counts. Surprisingly, visible light emissions from the Sun hardly vary over the course of this cycle; the Sun brightens and dims in the visible light region of the spectrum by only about 0.1%. This corresponds to a change in solar insolation at Earth of 1 or 2 W/m2 out of the 1,368 W/m2 that reach the top of Earth's atmosphere. In fact, sunspots are surrounded by regions that are slightly brighter than other portions of the photosphere, so the net effect is that overall the Sun is actually slightly brighter when sunspots are at a maximum, and slightly dimmer when there are fewer sunspots.
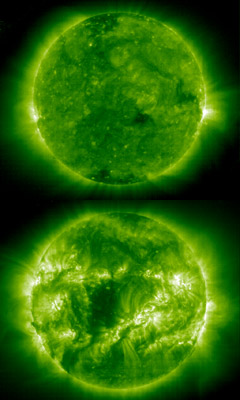
However, the variation in emissions of high energy X-rays and UV radiation is far more dramatic over the course of the sunspot cycle. UV emissions increase by factors of two to ten, while some X-ray emissions increase a hundred-fold when sunspot counts are high as compared to times when few sunspots appear. The images and interactive graph below illustrate the dramatic variations in the Sun's emissions in the high-energy X-ray and UV portions of the EM spectrum over the course of a sunspot cycle.
|
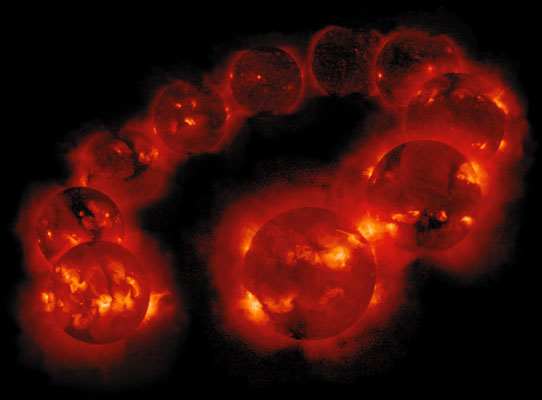
This montage of X-ray
images taken by the Yohkoh spacecraft shows the variation in the Sun's
X-ray brightness and appearance over the course of roughly one full sunspot
cycle. The image near the lower left is from 1991, near Solar Max; the
images in the upper center were taken near Solar Min; and the images in
the lower right and center are from a time near the following Solar Max
around 2001. |
Credit: Images courtesy of SOHO (NASA/ESA). Click on image to enlarge. |
|
Click the "Solar
Maximum" and "Solar Minimum" checkboxes (lower left) to
compare the Sun's energy emissions across the EM spectrum at these two
times in the sunspot cycle. Recall that the vertical axis represents relative
amounts of energy emissions, and that the scale of that axis is logarithmic
(each tick mark represents an increase/decrease of 100). |
Although astronomers have observed the fairly regular rise and fall of sunspot counts in this 11-year cycle for several centuries, there have also been disruptions in this pattern. The largest well-documented disruption was an era that lasted from about 1645 to 1715 during which almost no sunspots were seen. This long lull is known as the Maunder Minimum. Curiously, Europe and parts of North America were struck by spells of remarkably cold weather at roughly the same time. A period of cooler climate called the Little Ice Age extended from around 1350 to 1850, and some of its coldest periods roughly coincide with the times of decreased solar activity during the Maunder Minimum. Scientist are uncertain precisely what link, if any, might exist between the altered behavior of the Sun and the disruption of Earth's climate. There is also considerable debate as to the geographical extent of the Little Ice Age; some scientists think it was a worldwide phenomenon, while others think its effects were felt mainly in Europe and some parts of North America.
|
This graph shows
the number of sunspots seen each year for 400 years (from 1600 to 2000).
There were almost no sunspots during the Maunder Minimum. During the Dalton
Minimum, there were fewer sunspots than normal. |
There have been several other less dramatic dips in the level of solar activity, in terms of sunspot counts, over time. These include the Dalton Minimum (1790 to 1820), Spörer Minimum (1450 to 1540), Wolf Minimum (1280 to 1340), and Oort Minimum (1010 to 1050). Based on evidence other than direct observations of sunspot counts, in total there seem to have been 18 periods of sunspot minima in the last 8,000 years, and studies indicate that the Sun currently spends up to a quarter of its time in these minima. There have also been periods of enhanced solar activity in terms of greater sunspot counts. The Medieval Maximum lasted from about 1100 to 1250, and roughly corresponds to an extended warm period of Earth's (or maybe just Europe's) climate called the Medieval Warm Period that lasted from the 10th to the 14th century... further fueling speculation about possible links between solar activity and Earth's climate.
Longer Period Cycles
The 11-year sunspot cycle is a well-known phenomenon; its existence is well-established based on a large amount of supporting data. Scientists suspect that there may be other, longer-term cycles in the Sun and in the patterns of increase and decrease in sunspot counts. The existence of these patterns, however, is not as well supported; in many cases we simply do not have reliable records that go back far enough to confirm the cycles over a sufficient number of repeated occurrences of the the cycle in question. We present the following information concerning hypotheses about longer-term solar cycles for your reference; but realize that these are not well-established phenomena.
- The Gleissberg cycle has a period of somewhere between 70 and 100 years, possibly around 87 years.
- The Suess cycle allegedly has a period of 210 years.
- The longer Hallstatt cycle is postulated to have a period of 2,300 years.
- Solar activity levels influence the degree to which certain types (and energy levels) of particle radiation reach Earth, which in turn influences the formation rate of an isotope of carbon (carbon-14). These methods seems to indicate that there may be cycles with durations of 105, 131, 232, 385, 504, 805, and 2,241 years.
- Mineral layers in a certain rock formation indicate that, during the Upper Permian period 240 million years ago, a cycle with a period of 2,500 years may have existed.
The Faint Young Sun Paradox
The Sun has been around for about five billion years. Astronomers believe that its brightness hasn't always been the same as it is today. Based on models of stars and on observations of Sun-like stars that are in different stages of their life cycles, astronomers think our Sun was actually only about 70% as bright in its early days as compared to today. This means that Earth would have been receiving considerably less solar EM radiation at that time. Base on this level of energy influx, it seems that Earth would have been entirely frozen throughout much of its early history. Although there are some scientists who believe in a theory called "Snowball Earth" that claims Earth may have been gripped by global ice ages at times throughout its history (especially early on), most scientists agree that there is ample evidence that liquid water existed on Earth's surface throughout much of our planet's early history. These notions present a bit of a paradox: if Earth was receiving less sunlight to warm it, how could its temperature have been similar to that of modern times. This puzzle is known as the Faint Young Sun Paradox.
One possible solution to this puzzle involves Earth's atmosphere. As we'll see a bit later on, so-called greenhouse gases in our planet's atmosphere help to trap heat from sunlight in Earth's climate system, warming our planet more than one would otherwise expect. Carbon dioxide is one such greenhouse gas. Perhaps Earth's early atmosphere had much higher levels of carbon dioxide, which warmed our planet despite the Sun's relatively feeble energy output at the time.