The Sunspot Cycle
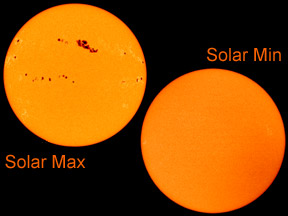
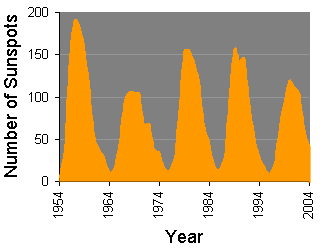
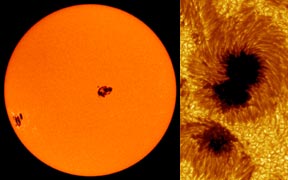
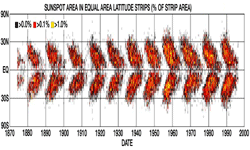
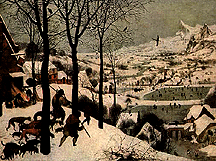
The number of sunspots observed on the "surface" of the Sun varies from year to year. This rise and fall in sunspot counts varies in a cyclical way. The length of the cycle is around eleven years on average. The cyclical variation in sunspot counts, discovered in 1843 by the amateur German astronomer Samuel Heinrich Schwabe, is called "the Sunspot Cycle". A peak in the sunspot count is referred to as a time of "solar maximum" (or "solar max"), whereas a period when few sunspots appear is called a "solar minimum" (or "solar min"). An example of a recent sunspot cycle spans the years from the solar min in 1986, when 13 sunspots were seen, through the solar max in 1989 when more than 157 sunspots appeared, on to the next solar min in 1996 (ten years after the 1986 solar min) when the sunspot count had fallen back down to fewer than 9. Along with the number of sunspots, the location of sunspots varies throughout the sunspot cycle. At solar min, sunspots tend to form around latitudes of 30° to 45° North and South of the Sun's equator. As the solar cycle progresses through solar max, sunspots tend to appear closer to the equator, around a latitude of 15°. Towards the end of a cycle, with solar min once again approaching, sunspots form quite close to the solar equator, around 7° North and South latitude. There is often an overlap in this latitudinal migration trend around solar min, when sunspots of the outgoing cycle are forming at low latitudes and sunspots of the upcoming cycle begin to form at high latitudes once again. This gradual equatorward drift of sunspots throughout the sunspot cycle, which was first noticed in the early 1860's by the German astronomer Gustav Spörer and the Englishman Richard Christopher Carrington, is often called Spörer's Law. In 1904 another English astronomer, Edward Walter Maunder, constructed the first "butterfly diagram", a graphical plot of this sunspot migration trend. The duration of the sunspot cycle is, on average, around eleven years. However, the length of the cycle does vary. Between 1700 and the present, the sunspot cycle (from one solar min to the next solar min) has varied in length from as short as nine years to as long as fourteen years. Note, however, that of the 26 solar cycles during that three-century span, 21 had a length between ten and twelve years. Arriving at a precise count of sunspots is not as straightforward as it might appear. Some spots are much larger than others, some sunspots partially merge together at their edges, and many spots appear in groups. In 1848 a Swiss astronomer named Rudolf Wolf devised an algorithm for making consistent counts of sunspots that allows comparisons between data from different observers across the centuries. The sunspot count derived using Wolf's formula, now known as the Wolf sunspot number, is still in use today. Wolf used data from earlier astronomers to reconstruct sunspot counts as far back as the 1755-1766 cycle, which he dubbed "cycle 1". Since then, subsequent cycles have been numbered consecutively, so the cycle that began with the 1996 solar minimum is cycle 23. The Sun is typically very active when sunspot counts are high. Sunspots are indicators of disturbances in the Sun's magnetic field, which can generate energetic solar events like solar flares and coronal mass ejections. Since reasonably reliable records of sunspot counts extend back to the early 1700s, long before other measures of solar activity could be observed, sunspot counts serve as a valuable, relatively long-term indicator of solar activity. The Sun emits significantly more radiation than usual in the X-ray and ultraviolet portions of the electromagnetic spectrum during solar max, and this extra energy significantly alters the uppermost layers of Earth's atmosphere. The 11-year sunspot cycle is actually half of a longer, 22-year cycle of solar activity. Each time the sunspot count rises and falls, the magnetic field of the Sun associated with sunspots reverses polarity; the orientation of magnetic fields in the Sun's northern and southern hemispheres switch. Thus, in terms of magnetic fields, the solar cycle is only complete (with the fields back the way they were at the start of the cycle) after two 11-year sunspot cycles. This solar cycle is, on average, about 22 years long - twice the duration of the sunspot cycle. Some scientists believe there is evidence for other, longer-period variations in the sunspot and solar cycles. Other scientists are skeptical about such claims. Most scientists think we need more data, spanning longer periods of time, to definitively resolve this issue. Besides these regular cycles, the Sun has exhibited periods of very unusual sunspot counts. Most notably, from about 1645 to 1715 there were very few sunspots - in some years none at all were observed! This period, now called the Maunder Minimum (after E.W. Maunder, who did important pioneering work related to this phenomenon), corresponded to an extremely cold spell in Europe known as the Little Ice Age. |
 History of Sunspot Observations
 Activity: Graphing Sunspot Cycles
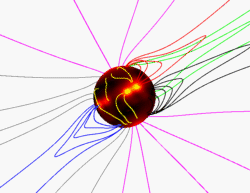
 Movie: Magnetic Field Lines Tangle as Sun Rotates
 Animation: Rotating Sun with Sunspots
![]() Video: Dark Days Ahead for the Sun (RealVideo courtesy of the National Science Foundation)
Video: Dark Days Ahead for the Sun (RealVideo courtesy of the National Science Foundation)
 Image: Solar Corona at Solar Max and Solar Min
 Image: X-ray Image of the Sun at Solar Max and Solar Min


