The Sun Today
Current and recent views of the Sun from observatories around the Earth and in space. Images are various wavelengths of visible light, ultraviolet, infrared, or X-ray emissions. Some pictures show the "surface" of the Sun; many others show material at specific heights and temperatures in the solar atmosphere.
Note: some images may be blank or "broken" at times; at night and on cloudy days (at least) for Earthbound observatories; at various intentional and accidental "down-times" for satellite-based solar telescopes.
 |
X-ray image of the Sun showing superheated plasma in the corona at temperatures between 3 and 5 million kelvins. Image courtesy of HINODE/NASA/JAXA. |
 |
Extreme ultraviolet image of the Sun showing hot plasma at temperatures around 1,000,000 kelvins. These emissions come from ionized iron atoms (Fe IX and Fe X) in the lower corona. Image courtesy of NASA Solar Dynamics Observatory (SDO) Atmospheric Imaging Assembly (AIA). |
 |
Extreme ultraviolet image of the Sun showing hot plasma at temperatures around 1.5 million kelvins. These emissions come from ionized iron atoms (Fe XII) in the solar corona. Image courtesy of NASA Solar Dynamics Observatory (SDO) Atmospheric Imaging Assembly (AIA). |
 |
Extreme ultraviolet image of the Sun showing hot plasma at temperatures around 60,000 to 80,000 kelvins. These emissions come from ionized helium atoms (He II) in the transition region of the Sun's atmosphere, on the border between the chromosphere and the corona. Image courtesy of NASA Solar Dynamics Observatory (SDO) Atmospheric Imaging Assembly (AIA). |
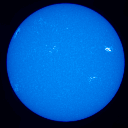 |
Violet/ultraviolet image of the Sun at a wavelength of 393 nm (on the border between purple visible light and ultraviolet radiation). These emissions come from ionized calcium atoms (Ca II K) in the Sun's chromosphere. Image courtesy of HAO's Mauna Loa Solar Observatory. |
| Red light image of the Sun at a wavelength of 656.3 nm. These emissions come from hydrogen atoms in the lower part of the Sun's chromosphere, within 1,700 km of the Sun's "surface". Astronomers call this wavelength band the "hydrogen alpha" emission line. Image courtesy of Big Bear Solar Observatory/New Jersey Institute of Technology. | |
 |
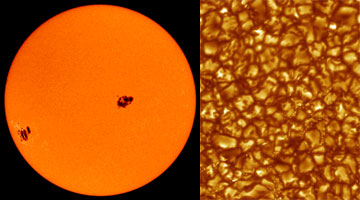
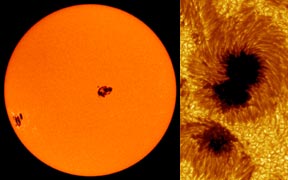
This visible light image of the Sun provides a view similar to what our eyes would see. The light in this image has a wavelength of 6,768 Ångstroms (the red portion of the visible spectrum) and is emitted by nickel atoms. This is a good view for detecting sunspots. Image courtesy of SOHO (ESA & NASA). |
 |
This magnetogram of the Sun's "surface" shows the strengths of magnetic fields on the Sun. Dark areas have south polarity, while bright white regions have north polarity. Image courtesy of NASA Solar Dynamics Observatory (SDO) Helioseismic and Magnetic Imager (HMI). |
 |
Infrared (IR) image of the Sun at a wavelength of 10,830 ångströms (1,083 nm). These IR emissions come from helium atoms (He I) in the Sun's chromosphere. Image courtesy of the National Solar Observatory/Kitt Peak, NOAO. |
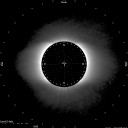 |
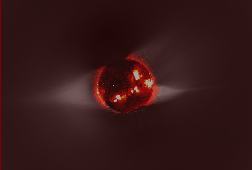
Image of the Sun's corona in red visible light and infrared radiation at wavelengths between 700 and 950 nm (7,000-9,500 ångströms). This coronagraph has a central black disk that covers the "body" of the Sun, creating an artificial eclipse and revealing the solar atmosphere. Image courtesy of HAO's Mauna Loa Solar Observatory. |


