This graph shows the number of sunspots seen each year. The graph covers 400 years, from 1600 to 2000. There were very few sunspots during the Maunder Minimum. The Dalton Minimum is another time when there were fewer sunspots than normal.
Click on image for full size
Image courtesy NASA (modified by Windows to the Universe staff).
History of Sunspot Observations
Humans have looked for and written down information about
sunspots for a very long time! In fact, the first time someone wrote down sunspot information was almost 3,000 years ago in China!
An English monk named John of Worcester made the first drawing of sunspots in 1128. Soon after the invention of the telescope, astronomers used the telescope to make observations of sunspots. This was around 1600.
Sunspot number across these many years has been linked to solar activity. Solar activity affects things on Earth in what we call "space
weather".
Sunpot number is also thought to be linked to climate. There is one famous time called the Maunder Minimum. It was from 1645 to 1715. There were not many sunspots found on the Sun during that time and there were really cold winters in Europe known as the Little
Ice Age. You can impress your teachers by telling them this though! Sunspot counts have
been higher than usual since around 1900, so some scientists
call
the time we are in now the Modern Maximum.
You might also be interested in:
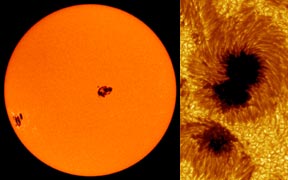
Sunspots are dark spots on the Sun. They may look small, but they are actually as bigas a planet like Earth or Mars! Sunspots are "dark" because they are colder than the areas around them. Of course, they
...more
From about 1250 to 1850 temperatures were a bit colder than usual in most parts of the world. This time is called the Little Ice Age. During the Little Ice Age, the average temperature of the planet was
...more
Spacecraft help us look at space weather. We can also make some space weather measurements from the surface of Earth. Instruments on the ground are cheaper and are easier to fix than instruments on spacecraft.
...more
Throughout the solar_cycle, the latitude of sunspot occurrence varies with an interesting pattern. The plot on the left shows the latitude of sunspot occurence versus time (in years). Sunspots are typically
...more
When the temperature in the core of a star is really hot (100 million degrees Kelvin!) fusion of Helium into Carbon happens. Oxygen is also formed when the temperature is this high. When it gets even hotter
...more
A plot of the binding energy per nucleon vs. atomic mass shows a peak atomic number 56 (Iron). Elements with atomic mass less then 56 release energy if formed as a result of a fusion reaction. Above this
...more
Nuclear fusion has been achieved in a controlled manner (that means no bombs are involved!!). Right now, these fusion experiments take in more energy than they produce. So they can't be used right now
...more